Also, starting with this post I'm going to make a conscious effort to switch from using OPS as my default batting stat to wOBA. wOBA, which is on the same scale as on-base percentage, is basically a version of OPS that uses more accurate weightings for events.
______________________________
On average, in 2012, the first time pitchers saw a batter they allowed a wOBA of about 0.338. The second time they saw those batters, the wOBA jumped to about 0.350, for a difference in wOBA of about 0.011. I'm going to name this statistic--wOBA for second plate appearances minus wOBA for fist--w-diff.
So the league average w-diff in 2012 was about 0.011. But different pitchers had different w-diffs.
Look, for instance, at R.A. Dickey. Dickey is a knuckleballer, and so one would expect hitters to be unusually bad the first time they see him--they have no practice hitting a knuckle-ball--but to get much better the second time, meaning one would expect him to have an unusually large w-diff. And, in fact, he does have a large w-diff over his career if you ignore all of the seasons in which he didn't have a large w-diff, which is a thing that makes a lot of sense to do if you have a personal vendetta against the year 2011.
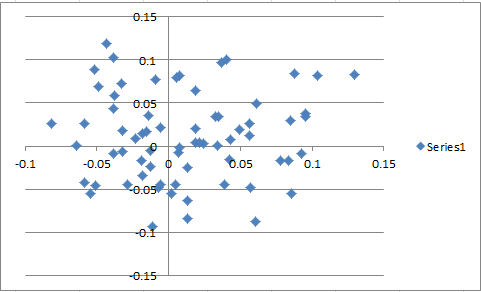
In fact, there is something slightly surprising about w-diff. I calculated w-diff for all pitchers who met an innings threshold* in both 2011 and 2012. 68 pitchers met this definition, and the correlation between w-diff in 2011 and 2012 for those pitchers was 0.0508. It seems that there is almost no correlation between w-diff for a pitcher between years (though w-diff across the league seems relatively stable: it was 0.0107 in 2011 and 0.0113 in 2012). So while it seems like pitchers in general do better the first time they see a hitter, there don't seem to be many pitchers who consistently over or under perform the league w-diff.
For those who like graphs, here's a graph of w-diff in 2011 on the x-axis and w-diff in 2012 on the y-axis for those 68 pitchers:
So, without further ado, I present you a list that I just said is meaningless: the pitchers with the top ten w-diff scores from 2012. Do you see any patterns in these pitchers? I don't. (Remember that league-average w-diff is 0.011.)
10: Yu Darvish
2012 w-diff: 0.083. 2011 w-diff: N/A.
9: Rich Porcello
2012 w-diff: 0.083. 2011 w-diff: 0.129.
8: Ivan Nova
2012 w-diff: 0.084. 2011 w-diff: 0.088.
7: Bartolo Colon
2012 w-diff: 0.089. 2011 w-diff: -0.052.
6: C.J. Wilson
2012 w-diff: 0.096. 2011 w-diff: 0.037.
5: Mat Latos
2012 w-diff: 0.101. 2011 w-diff: 0.041.
4: Vance Worley
2012 w-diff: 0.102. 2011 w-diff: -0.093.
3: Joe Saunders
2012 w-diff: 0.103. 2011 w-diff: -0.038.
2: Jon Lester
2012 w-diff: 0.119. 2011 w-diff: -0.043.
And, highest w-diff from the 2012 season belongs to:
1: Tommy Hunter
2012 w-diff: 0.170. 2011 w-diff: 0.177.
Tommy Hunter was a not very good starting pitcher for the Baltimore Orioles last season; his ERA was 5.45. But Tommy Hunter was an especially not very good starting pitcher the second time he saw a batter. I ran a basim simulation on his 2012 statistics the first and second times he saw batters. Basim predicted that the first time through the lineup, he would have a 3.06 ERA; the second time through his ERA would be 7.65. I guess the moral of the story is: friends don't let Tommy Hunter pitch past the second inning.
_________________________________________________________________________________
* technically, the (arbitrary) threshold that used was that they had to face at least 150 batters at lest twice in a game during the season, which is roughly equivalent to making at least 17 starts.
Sports Toto is divided into Private Toto and Batman Toto, Korean online betting sites. Main Page These are defined as security games and serve as mobile betting for sports betting users. This is the most useful site for sports analysts who use Toto and Protobetting. 토토사이트 사이트 이동 안전놀이터
ReplyDelete